Table of Contents
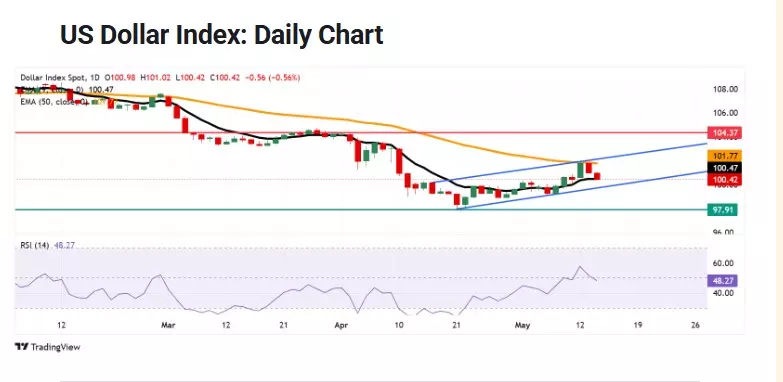
ToggleThe US Dollar Index (DXY) remains in focus as it tests the critical 100.50 support area, supported by the nine-day EMA, signaling short-term bullish sentiment despite some downward pressure. This US Dollar Index Forecast explores technical and fundamental indicators shaping the current price action.

Technical Outlook: US Dollar Index Forecast Remains Within Bullish Channel
The DXY continues to trade within a well-defined ascending channel on the daily chart, suggesting that the longer-term uptrend remains intact. While short-term momentum has softened, the index remains above the nine-day Exponential Moving Average (EMA), currently at 100.47, which serves as immediate support.
Moreover, the 50-day EMA, positioned near 101.78, offers a critical resistance level. A sustained break above this level would confirm the bullish trend continuation and open the door to retesting the upper boundary of the channel near 102.10.
However, the 14-day Relative Strength Index (RSI) has dipped below the 50 mark, signaling a potential shift in momentum. If RSI fails to recover above 50 in the coming sessions, bearish pressure may build up.
US Dollar Index Forecast: Upside Levels to Watch
From a technical standpoint, bulls will be eyeing the following levels:
101.78 – 50-day EMA: A close above this zone would be seen as a positive breakout.
102.10 – Upper channel resistance: Breaking through here could extend the rally toward key highs.
104.37 – Two-month high (April 1): This represents a major resistance level and bullish target if momentum accelerates.
A breakout above these levels would reaffirm the overall bullish US Dollar Index forecast for Q2 2025.
Support Zones and Bearish Risks
On the downside, immediate support lies at:
100.47 – Nine-day EMA: This level is under test and is key for holding the short-term bullish case.
99.80 – Lower boundary of the ascending channel: A break below here would neutralize the bullish setup.
97.91 – Multi-year low from March 2022: This long-term support would come into focus if broader dollar weakness emerges.
Should DXY fall below 99.80, it could trigger a technical breakdown, shifting sentiment bearish in the medium term.
Fundamental Analysis: Macro Factors Driving DXY
Recent U.S. economic data continues to influence dollar performance. While April CPI data showed signs of easing inflation, it wasn’t soft enough to rule out future rate hikes by the Federal Reserve.
In addition:
Labor market data remains resilient, supporting a stronger USD.
Trade tensions and geopolitical developments—particularly U.S.-China relations—have also added volatility.
Fed policy expectations are currently mixed, with markets pricing in a possible pause in tightening but no clear path to rate cuts in the near term.
These mixed signals contribute to the DXY’s consolidation phase.
Market Sentiment and Positioning
Market sentiment is cautiously optimistic for the dollar, with traders awaiting more clarity from upcoming Fed communications and economic reports. The Commitment of Traders (COT) data shows a slight reduction in net long USD positions, reflecting reduced conviction among large speculators.
Increased risk appetite in equity markets could weigh on the dollar in the short term, while renewed safe-haven demand (due to geopolitical risk) would favor DXY upside.
Conclusion and Forecast Summary
In summary, the US Dollar Index forecast remains cautiously bullish above 100.50. Key technical support levels are holding for now, and any move above 101.78 could catalyze a fresh bullish wave toward 104.00+. However, if the index fails to hold 100.50 and breaks below 99.80, bearish momentum could intensify.
✅ Get Daily Forex Updates
Join now to receive daily DXY signals, news, and analysis on your phone.
🔗 Recommended Reading
What is the US Dollar Index (DXY)?
The US Dollar Index measures the value of the U.S. dollar relative to a basket of six major currencies, providing insight into the dollar’s global strength.
What does a rising DXY mean?
A rising DXY indicates a strengthening dollar, often due to higher U.S. interest rates, strong economic data, or safe-haven demand.
How do moving averages affect DXY trading?
Moving averages like the 9-day and 50-day EMA help identify short- and medium-term trends, providing traders with key support/resistance zones.
What events can influence the US Dollar Index?
Key drivers include U.S. inflation reports, Federal Reserve decisions, employment data, geopolitical tensions, and global risk sentiment.


