Published by SmartFXGuide – Updated July 13, 2025
🔍 Introduction

Weekly Forex Outlook: July 15–19, 2025 begins with cautious optimism across global markets. Last week, traders reacted to mixed U.S. inflation data, sending the U.S. dollar slightly lower and giving risk assets like gold and major stock indices a rebound. While uncertainty over global growth remains, this sets the stage for a potentially volatile yet opportunity-filled week in forex trading.
As we enter the week of July 15–19, 2025, several high-impact economic events are expected to drive volatility across major currency pairs. This weekly forex outlook highlights the key events, technical levels, and potential trading opportunities you should watch.
📅 Weekly Economic Calendar: July 15–19, 2025
| Date | Event | Expected Impact | Forecast | Previous |
|---|---|---|---|---|
| July 15 | China GDP Q2 (YoY) | AUD, NZD, CNY | 4.8% | 5.3% |
| July 15 | US CPI (June) | USD – high impact | 0.1% MoM / 3.0% YoY | 0.0% MoM / 3.3% YoY |
| July 16 | UK Unemployment Rate (May) | GBP – medium impact | 4.1% | 4.2% |
| July 17 | US Retail Sales (June) | USD – high impact | +0.2% | -0.9% |
| July 18 | Australia Employment Change (June) | AUD – high impact | +29.5K | +39.7K |
Data compiled from official reports: U.S. Bureau of Labor Statistics, Investing.com, and Chicago Fed.
 Market Sentiment Overview
 Market Sentiment Overview
- USD: Slightly bearish. Recent soft US CPI (0.1% MoM, 3.0% YoY) is pressuring the dollar ahead of retail sales data.
- EUR: Range-bound. Supported mildly by German resilience, but dependent on US data for direction.
- JPY: Bearish. BOJ’s continued dovish stance and yield curve control keep pressure on yen.
- Gold: Bullish bias. Gold rebounded sharply, driven by falling US yields and soft inflation.
- Risk Sentiment: Mild risk-on. Equities are stable, but fragile confidence ahead of data releases.
Technical Outlook: Major Forex Pairs
 Technical Outlook: Major Forex Pairs
EUR/USD
 EUR/USD
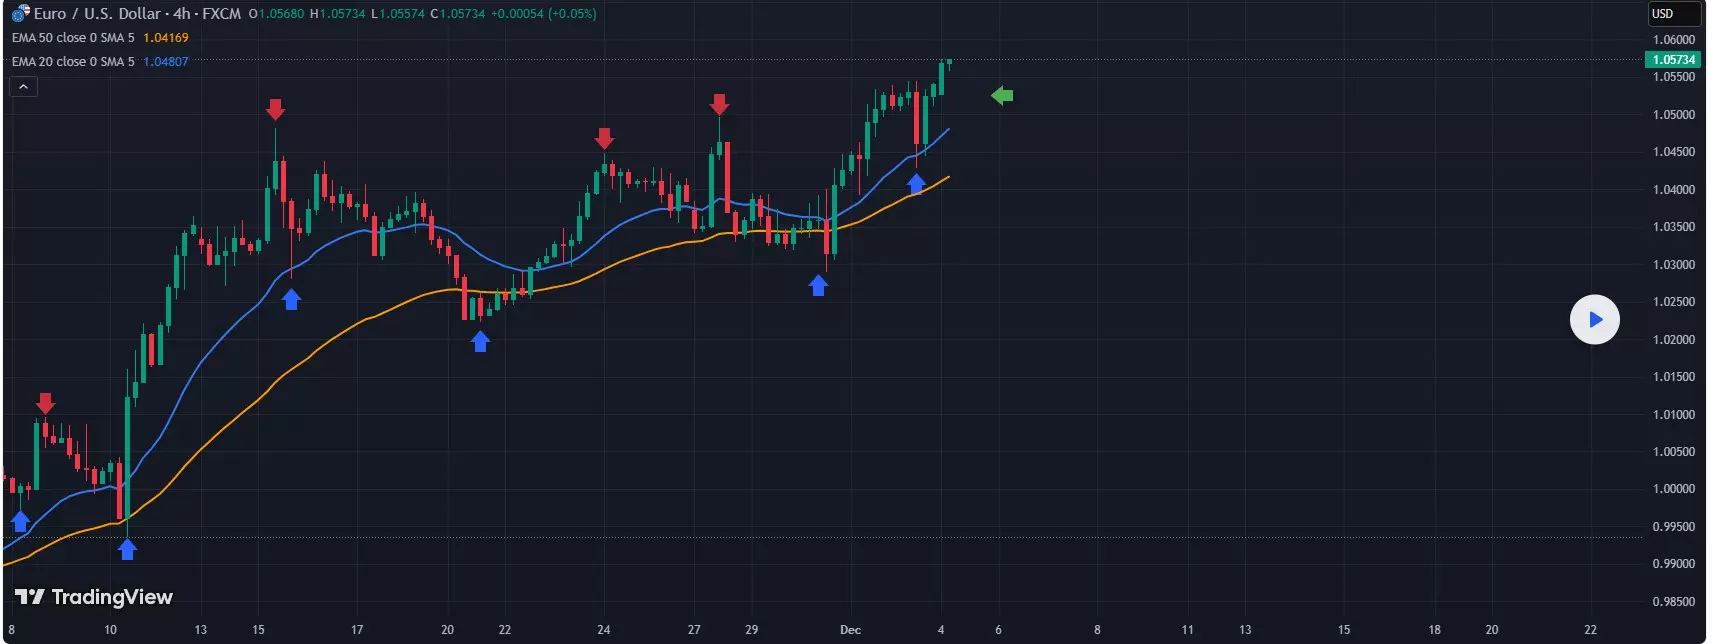
Current Price: 1.05734
Indicators:
• EMA 20 (Blue) and EMA 50 (Orange) are in a bullish alignment.
• Price is consistently closing above both EMAs, suggesting strong upward momentum.
• The recent green candle with a breakout above previous highs confirms bullish continuation.Trend:
The pair is in a clear uptrend with higher highs and higher lows forming.
Multiple bullish crossovers and successful retests of moving averages signal buyer control.Key Levels:
• Immediate Resistance: 1.0600 (psychological round number)
• Support Zone: 1.0500 / 1.0460 (previous EMA bounce areas)Outlook:
As long as EUR/USD stays above the 20 EMA and maintains momentum, further upside toward 1.0650–1.0700 is possible. A break below 1.0500 would weaken the structure and may signal short-term consolidation.
📌 Trading Bias: Bullish
📉 Risk Note: Watch for exhaustion signals near 1.0600 resistance.
Gold (XAU/USD)
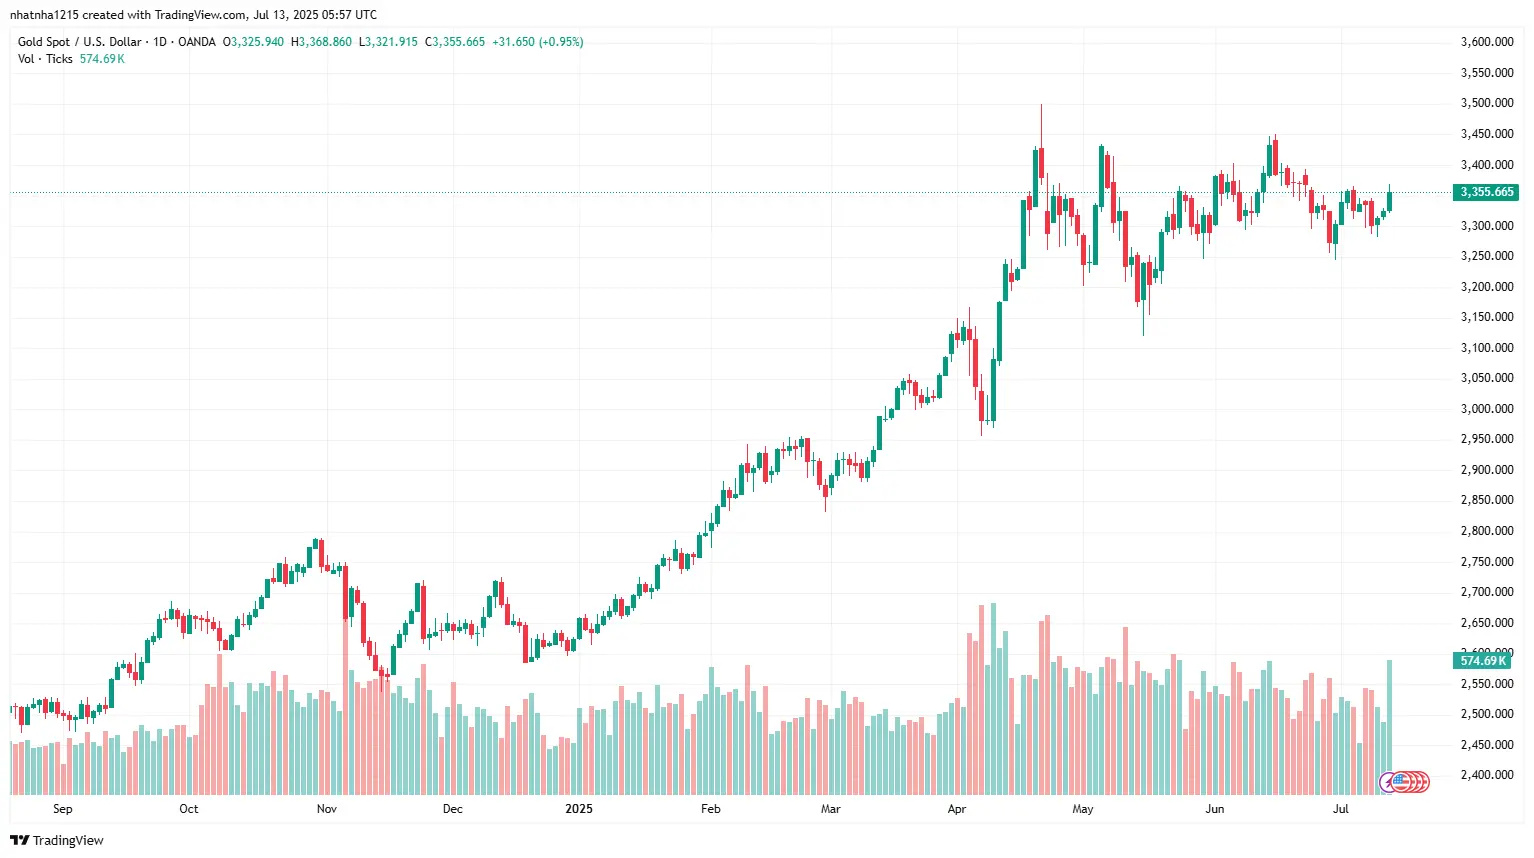
Current Price: $3,355.67
Daily Range:
• High: $3,368.86
• Low: $3,321.91
• Change: +$31.65 (+0.95%)
📊 Chart Observations:
Gold remains in a consolidation phase after a strong rally that peaked around $3,550 in May 2025.
Price action is sideways between $3,200 and $3,450, forming a broad range for nearly two months.
The current candle shows strong buying pressure with a bullish body and healthy volume (~574K ticks), suggesting short-term upside potential.
Volume spikes during the latest green candles indicate renewed buying interest.
No clear breakout yet – the market is still undecided around this consolidation zone.
📌 Key Technical Levels:
Immediate Resistance: $3,400 and $3,450
Breakout Resistance: $3,550 (previous swing high)
Support Zone: $3,300 and $3,250
Major Support: $3,100
📈 Outlook:
Gold is attempting to build bullish momentum after bouncing from $3,300 support. A daily close above $3,400 could pave the way for a retest of $3,450–$3,500.
However, if gold fails to hold above $3,300, it may slide back toward $3,250 or even $3,100, especially if bond yields spike or USD strengthens unexpectedly.
✅ Trading Bias: Neutral to Slightly Bullish
Wait for confirmation of breakout from current range.
Watch U.S. economic data and real yields – they will drive short-term direction.
🔹 AUD/USD
AUD/USD – Daily Technical Analysis (Updated July 13, 2025)
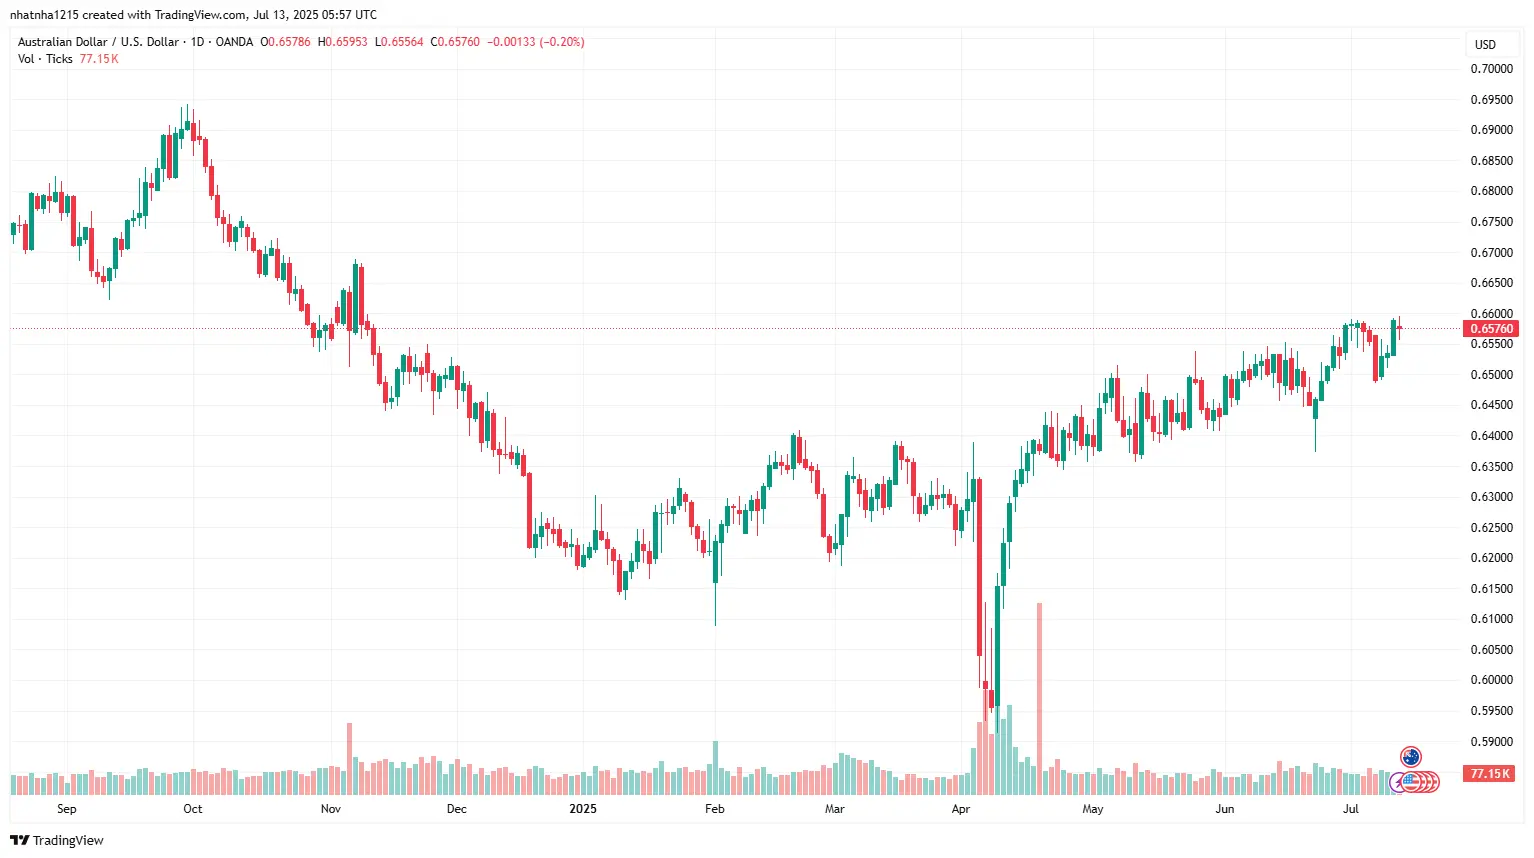
Current Price: 0.6576
Change: -0.20% on the day
Volume: 77.15K (moderate activity)
🔍 Technical Overview:
AUD/USD continues its bullish recovery from the March low and is now testing a key resistance zone around 0.6600. Price action shows a steady sequence of higher lows since April, indicating growing buying pressure.
The pair is trading above the recent consolidation zone between 0.6450 – 0.6550, suggesting potential for a breakout.
However, the rejection wick near 0.6600 shows caution — this level has acted as a psychological and structural resistance since February.
If price breaks and closes above 0.6600, the next upside target lies around 0.6680.
On the downside, immediate support lies at 0.6510, with a stronger base around 0.6420.
📊 Trend & Momentum:
The overall trend is bullish short-term, but still neutral medium-term as the pair has not yet broken the broader range.
Volume remains steady, not confirming a breakout yet — suggesting watch for volume spike on a confirmed close above 0.6600.
Momentum indicators (not visible but assumed from price action) likely near overbought zone, so watch for possible pullback or consolidation.
🧠 Key Drivers to Watch:
China GDP (due July 15) could significantly influence AUD sentiment.
Upcoming Australia jobs data (July 18) may also shift short-term direction.
Overall risk sentiment and USD strength remain crucial.
📌 Outlook:
Bias: Mildly bullish
If AUD/USD breaks above 0.6600 with strong volume, bulls may aim for 0.6680–0.6720. However, failure to hold current levels may trigger a retracement back toward the 0.6510 support zone.
🔹 USD/JPY
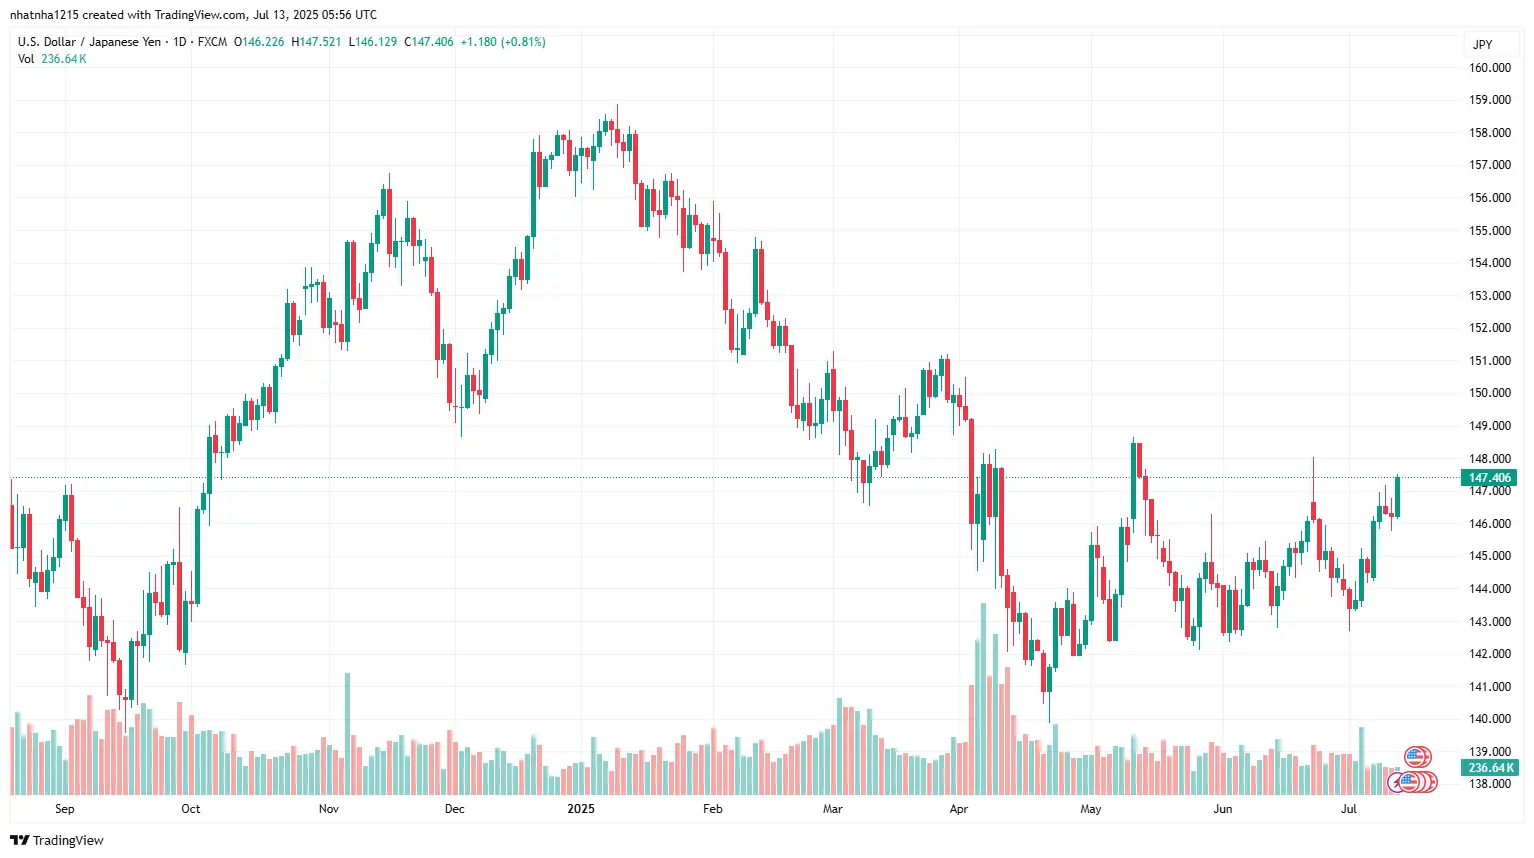
Current Price: 147.406
Change: +0.81% on the day
Volume: 236.64K (strong activity)
🔍 Technical Overview:
USD/JPY is showing renewed bullish momentum as the pair approaches a key resistance zone near 148.00. The recent breakout from the mini-range between 144.50 – 146.50 has added confidence to bulls.
The price action has created a short-term higher low, suggesting buying interest around 144.00.
A daily close above 148.00 could open the door toward the next resistance at 149.20–150.00.
However, caution is warranted — the 148 level has triggered verbal intervention threats from Japanese officials in the past.
📊 Trend & Momentum:
Trend has turned bullish in the short-term, but still range-bound in the medium-term unless 150 is cleared.
Volume spike today shows strong institutional interest behind the move.
RSI (not shown) is likely pushing into overbought territory — watch for possible exhaustion near 148.
🧠 Key Drivers to Watch:
BoJ policy tone remains dovish, suppressing the yen.
U.S. economic data and Treasury yields are primary catalysts.
Possible FX intervention headlines around 148–150 should not be ignored.
📌 Outlook:
Bias: Bullish with caution
A break above 148.00 may attract more buyers toward 149.50–150.00. But any failure to break that zone decisively could result in a sharp pullback toward 145.80 or lower.
🧭 Final Thoughts: Navigating a Volatile Week Ahead
As we head into a data-packed week, traders should brace for elevated volatility across major forex pairs. With U.S. retail sales, CPI updates, and earnings season in full swing, every headline could tip the scales of market sentiment.
Whether you’re eyeing a breakout in gold, momentum in GBP/USD, or retracements in USD/JPY, now is the time to stay sharp, stay informed, and stick to your trading plan.
Use tight risk management, watch for fakeouts during news events, and review your setups daily.
Smart trading is not just about predicting the move — it’s about preparing for all possibilities.

📚 Further Reading
If you found this weekly outlook helpful, you may also enjoy:
🔍 How to Read Forex Candlestick Charts – Master key patterns to boost your entry timing.
📈 USD Index Today – Key Levels to Watch – Analyze how dollar strength affects all major pairs.
💼 Top Prop Firms in 2025: Growth & Trust – Discover trusted firms offering funded accounts for forex traders.
Note: This article provides information, not financial advice. Trade responsibly based on your own analysis.