
Reading forex charts is one of the most important skills a beginner trader must master. These charts are your window into the dynamic world of currency markets. They reveal price movements, trading volume, and patterns that help predict future trends. But to the untrained eye, they can look like a confusing mix of colors, lines, and bars.
In this guide, we’ll break down the essentials of how to read forex charts — especially candlestick patterns and price action. Whether you’re brand new to trading or trying to sharpen your technical skills, this beginner-friendly walkthrough will help you:
- Understand the basics of forex charts (line, bar, and candlestick types),
- Learn how to read common candlestick patterns like Doji, Engulfing, and Hammer,
- Use price action strategies to make more informed decisions.
Let’s begin by understanding the foundation: the types of forex charts and what they show you.
Types of Forex Charts: Line, Bar, and Candlestick
Before diving into candlestick patterns and price action, it’s important to understand the three main types of forex charts. Each has its own purpose and level of detail.
🔹 Line Chart
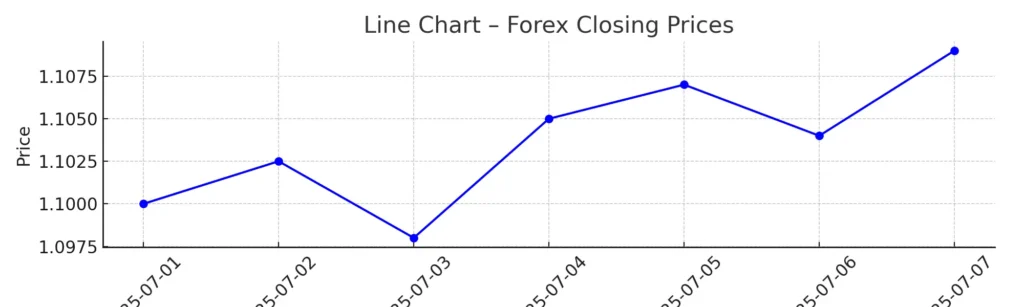
A line chart is the most basic type. It connects the closing prices of a currency pair over a period of time with a straight line.
- Best for: Beginners who want a clean overview of price trends.
- Limitations: It doesn’t show highs, lows, or opening prices — just the close.
Example:
If EUR/USD closes at 1.1050 today and 1.1080 tomorrow, the line will rise, showing a price increase.
🔹 Bar Chart
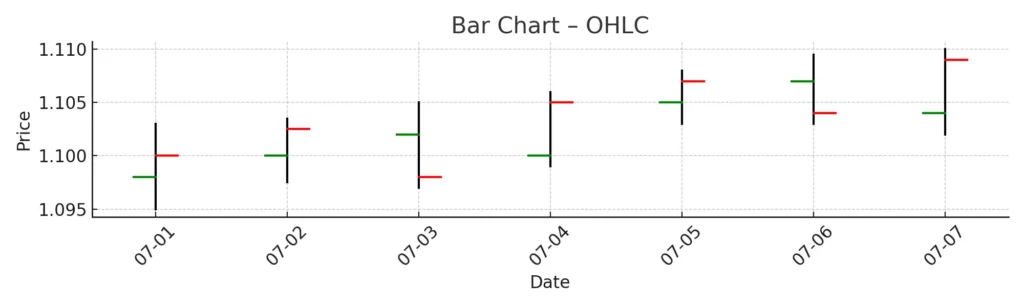
A bar chart provides more detail. Each bar shows the opening, high, low, and closing prices (often called OHLC) for a specific time period.
- Best for: Traders who need more context about price movement.
- Structure: The vertical line shows the price range, while the horizontal dashes represent open (left) and close (right).
Bar charts help you see volatility and price direction more clearly than line charts.
🔹 Candlestick Chart
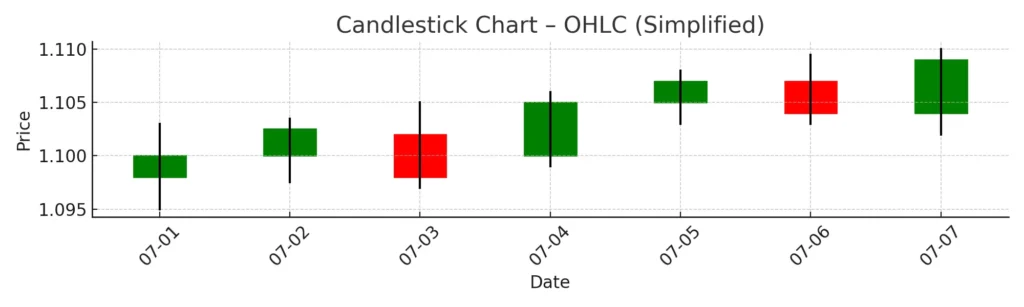
The candlestick chart is the most popular among forex traders.
- Each candlestick represents a specific time period (e.g., 1 hour, 1 day).
- It displays open, high, low, and close just like a bar chart — but in a visually clearer format.
- Color indicates price direction: typically green (bullish) if price closes higher than it opened, and red (bearish) if it closes lower.
Candlestick charts are powerful because they also form patterns — visual cues that traders use to predict market behavior.

Candlestick Patterns Explained: Doji, Hammer, Engulfing, and More
Candlestick patterns are essential tools for traders who want to analyze price action and predict potential market reversals or continuations. These patterns appear on candlestick charts and reflect the psychology of market participants over a given timeframe. Understanding them helps traders make smarter decisions based on visual price behavior.
Below are some of the most popular candlestick patterns and what they mean.
1. Doji Candle – Sign of Indecision
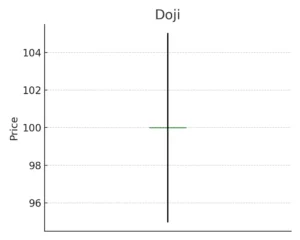
A Doji forms when the open and close prices are almost equal, resulting in a candle with a very small body and long wicks (shadows) on either side.
What it means:
The market is undecided. Neither buyers nor sellers are in full control, often signaling a potential reversal if it occurs after a strong trend.
Common Types of Doji:
- Standard Doji: Equal open and close, long wicks.
- Gravestone Doji: Bearish signal after an uptrend.
- Dragonfly Doji: Bullish signal after a downtrend.
2. Hammer – Bullish Reversal
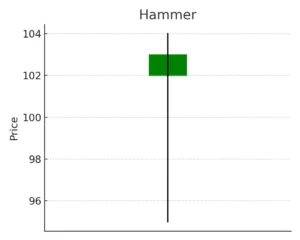
A Hammer is a single candle with a small body and a long lower wick, typically forming after a downtrend.
What it means:
Buyers have stepped in to reject lower prices, suggesting a possible bullish reversal.
Tip:
Always confirm with the next candle. A strong bullish candle after a hammer increases the signal’s reliability.
3. Inverted Hammer – Also Bullish, But Trickier
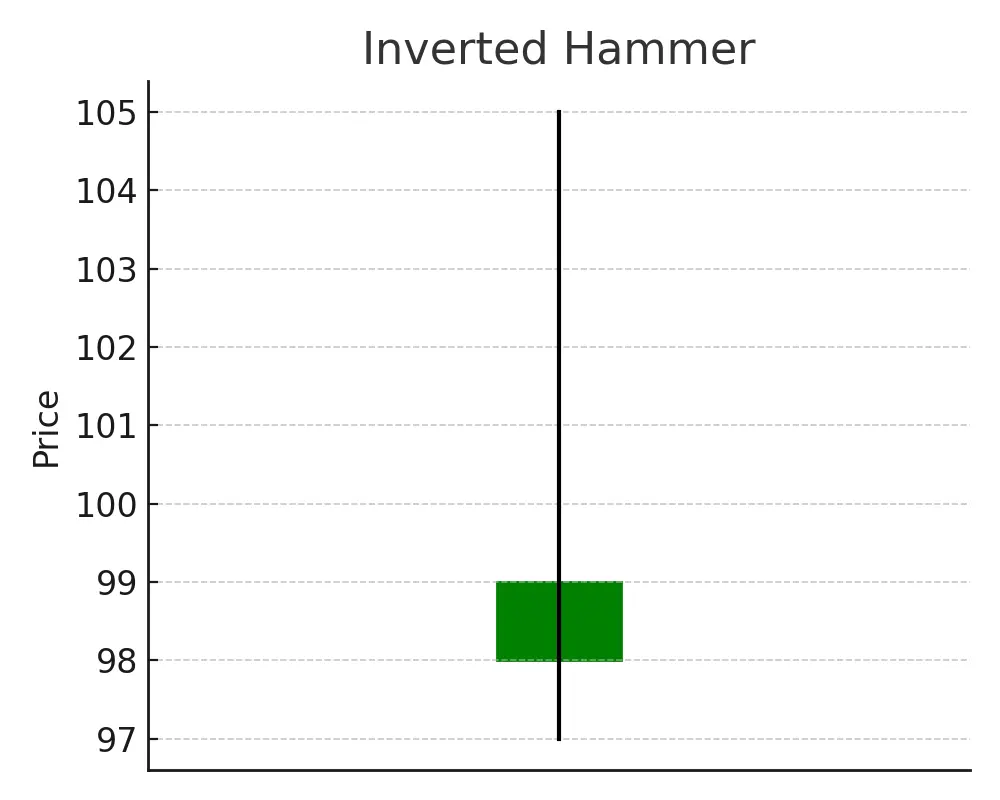
Looks like a hammer flipped upside-down: small body at the bottom with a long upper wick. Appears after a downtrend.
What it means:
Possible bullish reversal, showing buyers attempted to push price higher.
Note:
This pattern needs strong confirmation from the next bullish candle.
4. Shooting Star – Bearish Reversal
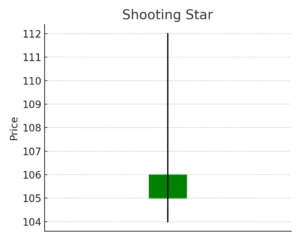
A Shooting Star is the bearish version of the inverted hammer and appears at the top of an uptrend.
What it means:
Bulls tried to push prices higher but failed. Sellers may take over soon.
Ideal Entry:
After a strong bearish candle confirms the reversal.
5. Bullish Engulfing – Reversal Signal After a Downtrend
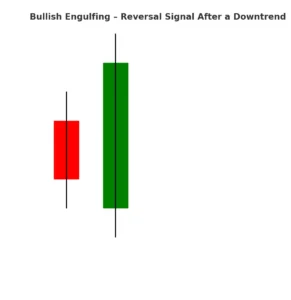
This is a two-candle pattern. The first candle is small and bearish, followed by a large bullish candle that completely “engulfs” the previous one.
What it means:
Strong buying pressure. A bullish reversal could follow.
Best Used:
After a clear downtrend and near a support level.
6. Bearish Engulfing – Reversal After an Uptrend

Opposite of the bullish engulfing. A small bullish candle is followed by a large bearish candle that completely engulfs it.
What it means:
Strong selling pressure. The trend may reverse downward.
7. Morning Star – Bullish Reversal (Three Candles)
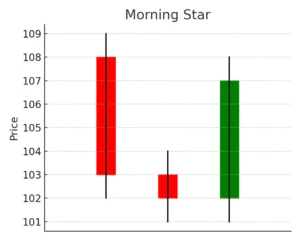
This pattern includes:
- A long bearish candle
- A small-bodied candle (can be bullish or bearish)
- A strong bullish candle
What it means:
Sellers are losing control, and buyers are taking over.
8. Evening Star – Bearish Reversal
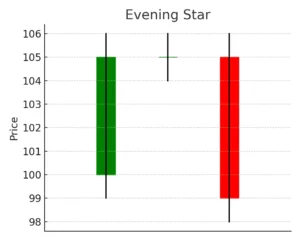
The bearish counterpart to the Morning Star. It starts with a strong bullish candle, followed by a small one, then a strong bearish candle.
What it means:
Bulls are losing momentum, and a bearish reversal is likely.
🧠 Final Thoughts
Candlestick patterns offer a visual insight into market sentiment. However, they should not be used in isolation. Combine them with other technical tools like support/resistance, RSI, moving averages, or volume for better confirmation.
Quick Rule of Thumb:
Always look for context — patterns are more powerful when they appear after strong trends, near key levels, or alongside confluence factors.