Understanding the ABCD Pattern in Forex Trading Strategies

ABCD Pattern in Forex is built upon Fibonacci ratios, which are not only essential for identifying support and resistance levels but also form the basis of this powerful charting strategy

What is the ABCD Pattern?

The ABCD pattern is a distinct geometric formation on price charts, consisting of three sequential price movements. Resembling a slanted lightning bolt, this pattern often signals potential trading opportunities.

Understanding this pattern is crucial as it captures the natural rhythm in market movements. It consists of four key points:

  • A: The starting point of a new trend

  • B: A retracement of the trend

  • C: The continuation of the initial trend

  • D: The potential reversal or correction point

This pattern can manifest in both bullish and bearish scenarios across various markets, such as forex, stocks, and others. It is also applicable in all market conditions—whether in ranging markets, uptrends, or downtrends—and across all timeframes.

 
ABCD pattern

How to Identify the ABCD Pattern in Forex Trading

The ABCD pattern is a powerful tool for traders, offering clear entry and exit points when identified correctly. Here’s a step-by-step guide on how to spot this pattern and validate it using Fibonacci ratios.

Recognizing the ABCD Structure

Traders identify the ABCD pattern by focusing on its legs, or the price movements between specific points:

  • AB and CD: Represent movements in the direction of the prevailing trend.

  • BC: Serves as a retracement of the trend.

Each leg typically spans between 3 to 13 bars. If a pattern exceeds 13 bars, it’s a good idea to shift to a higher timeframe to reassess the trend and confirm Fibonacci convergence.

Validating the ABCD Pattern with Fibonacci Ratios

Once you think you’ve identified an ABCD pattern, Fibonacci ratios can help verify its accuracy and pinpoint the potential completion zone for opening a trade.

  • ABCD Pattern in Forex
    ABCD Pattern in Forex

    Classic ABCD Ratios:
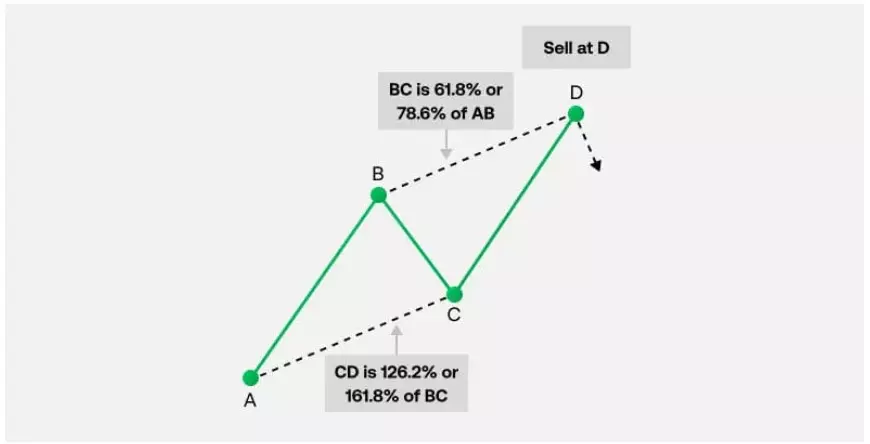
    In a standard ABCD formation, the BC leg retraces 61.8% or 78.6% of AB. Use a Fibonacci retracement tool on the initial AB leg to confirm if BC ends near these levels.

  • Alternate Ratios for Trending Markets:
    In strong market trends, BC may retrace only 38.2% or 50% of AB.

  • CD Leg Projections:
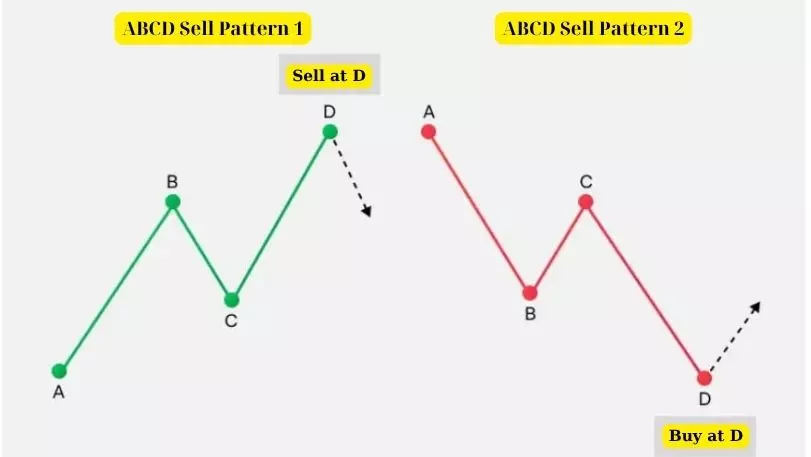
    The CD leg often extends 127.2% or 161.8% of BC. At this point:

    • For a bearish ABCD, consider entering a sell position.

    • For a bullish ABCD, look for a buying opportunity.

Applying the ABCD Pattern in Forex

The ABCD pattern is versatile, appearing across various markets and timeframes. Traders can combine this pattern with other technical analysis tools, such as trendlines and support/resistance levels, to refine their strategies further.

By mastering the ABCD pattern and leveraging Fibonacci ratios, traders gain a reliable method to identify potential trade setups with precision.

ABCD Pattern Extensions and Rules in Forex Trading

The ABCD pattern is a popular geometric formation in technical analysis, but occasionally, you might encounter an ABCD extension. In this variation, the CD leg extends significantly longer than AB, typically by 127.2% or 161.8%. Understanding and identifying these extensions can reveal valuable trading opportunities.


Key Features of the ABCD Extension

An ABCD extension occurs when the CD leg surpasses the length of AB, indicating strong market momentum. Traders often use Fibonacci ratios to confirm this pattern and predict price targets at completion.


General ABCD Pattern Rules

To identify and confirm an ABCD pattern, traders adhere to a set of rules for each segment:

  1. AB and CD Should Be Equal in Length and Time

    • In classic ABCD patterns, the AB and CD legs are generally similar in size and duration. However, extensions like the ABCD pattern may have a CD leg that significantly exceeds AB.

  2. Price Movements Within the Pattern

    • During the A-to-B move, prices should not exceed point A or drop below point B.

    • Similarly, the B-to-C retracement should stay within B and C bounds.

    • For C-to-D, prices should not surpass point C or dip below point D.


Bullish ABCD Pattern Rules (Buy at Point D)

  1. Find AB:

    • Point A is a significant high.

    • Point B is a significant low.

    • The move from A to B must remain within the defined highs and lows.

  2. Identify BC:

    • Point C is lower than point A.

    • No lows should fall below point B, and no highs should exceed point C.

    • BC retraces 61.8% or 78.6% of AB, though it may be 38.2% or 50% in strong trends.

  3. Draw CD:

    • Point D lies below point B.

    • CD may be equal to AB or extend to 127.2% or 161.8% of AB or BC in length.

    • Timewise, CD may equal AB or range between 61.8% and 161.8% of AB’s duration.

  4. Confirm Pattern Convergence:

    • Look for trend, Fibonacci, and pattern alignment near point D.

  5. Watch for Market Behavior:

    • Price gaps or wide-ranging candles in the CD leg near point D often signal strong momentum, indicating potential extensions.


Bearish ABCD Pattern Rules (Sell at Point D)

  1. Find AB:

    • Point A is a significant low.

    • Point B is a significant high.

    • No highs should exceed point B, and no lows should dip below point A.

  2. Identify BC:

    • Point C is higher than point A.

    • Retracements should respect the range between points B and C.

    • BC ideally retraces 61.8% or 78.6% of AB, though it may be 38.2% or 50% in strong trends.

  3. Draw CD:

    • Point D lies above point B.

    • CD may equal AB or extend to 127.2% or 161.8% of AB or BC.

    • CD’s duration may mirror AB or follow Fibonacci time ratios.

  4. Validate the Pattern:

    • Look for price and time alignments using Fibonacci tools.

  5. Monitor Price Action:

    • Wide-ranging bars or gaps in the CD leg as it approaches D often signal an extension with strong momentum.


By mastering these rules and paying close attention to Fibonacci levels and market dynamics, traders can effectively spot and trade both standard ABCD patterns and their extended variations.

Comments

No comments yet. Why don’t you start the discussion?

    Leave a Reply

    Your email address will not be published. Required fields are marked *